So you’ve invested in a great website, but how can you tell if it’s helping your business? If you’re relying on feedback from people who have visited your website, or gauging the success of your website by the amount of contact forms you’re getting, that’s not enough.
What you really need is data, and luckily, if you’ve connected Google Analytics to your website, you’ve got it at your fingertips. When it comes to understanding your website’s traffic, how it’s performing, and how it stacks up to your competitor’s websites, Google Analytics is your go-to, and it’s absolutely essential for all business owners.
But what if you’re allergic to numbers, or the mere mention of the word “analytics” gets your heart pumping (and not in a good way)? You can relax, because getting the basics of Google Analytics is easy. In fact, the platform is simple enough for almost anyone to understand.
Below we show you how to read a basic Google Analytic report, as well as how to add Google Analytics to your website if it’s not already installed. Even if you’re not interested in checking out your website’s performance on a regular basis, you can still use the information below to help you better understand your website’s performance when talking about it with your digital marketing team.
Audience Overview
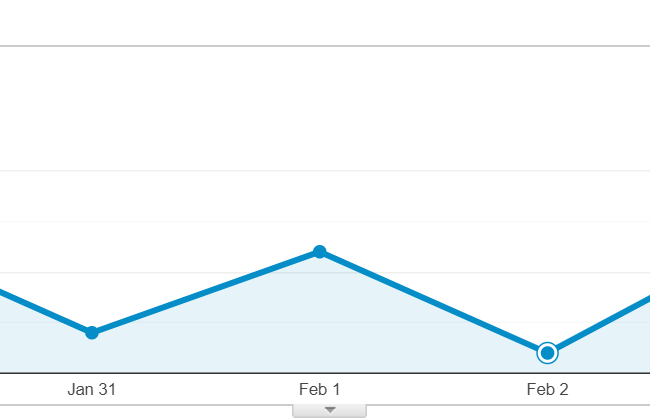 First, it’s important to know that you can set a timeframe to look at traffic for a specific date range. You’ll find the calendar on the top right corner within Google Analytics. When you choose the date range, you can also choose whether to compare the dates to that of a previous period. So you could look at the current month or week, for example, compared to the one before.
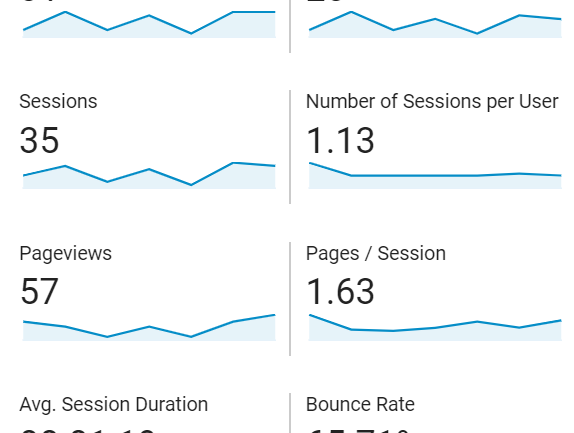 Once that’s set up, take a look first at your audience overview. You’ll find this on the top of the menu on the left hand side. Here you’ll be able to see how many users your website had for the date range, sessions, page views, average session duration and bounce rate.
- Users. Google Analytics breaks this down into two categories: users and new users. Users are the amount of visitors to the site within your specified period. New users are those who have not visited your site before. You’ll want this number to be steady or increase over time. If it isn’t or if it drops, it’s time to make some improvements.
- Sessions. This section is divided into sessions, number of sessions per user, and pages per session – and all of these track how many visits your website gets with the range you have selected. Every visit is a session, and the number of sessions per user tracks just that – the average number of times they visit your site. The third, pages per session, looks at the average amount of pages a user views.
Note: If the average here is low, or your average falls between one or two pages per session, that’s not always reason to worry. Users on mobile devices will often visit just one page, and those using a desktop computer might also visit the home page only and get all the information they need there.
- Average Session Duration. Don’t get too caught up on this one, especially if the average session duration on your site or for a web page is low. The way Google measures this is tricky (and a bit confusing). Even if a visitor remains on a page on your site for, say, fifteen minutes to do something like read a blog post, Google may still count the session duration low.
- Bounce rate. This number is a better gauge of how long users are staying on your site, but don’t be alarmed by a high bounce rate. Many people get the information they need right from the home page, so they’ll “bounce” off the website quickly. Additionally, mobile users are not as apt to linger on a website the way desktop users do, so the higher your mobile traffic, the higher your bounce rate may be.
Acquisition
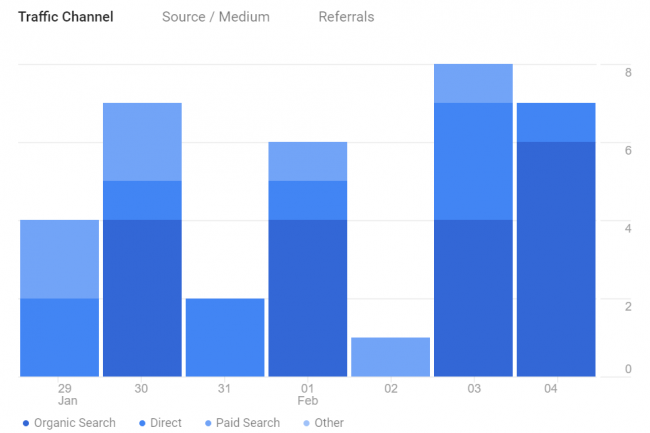 This is where you can see how people are finding and engaging with your website. Ideally, your organic traffic should be first or second in the breakdown, followed by direct and referral traffic. Of course, if you’re running a robust digital ad campaign, have a huge social media following, or are running display ads, the breakdown may look different.
- Organic traffic. Here’s where you’ll see users who visit your site from a search engine like Google, Bing, or Yahoo.
- Direct. This category is interesting. Usually, this is traffic generated by users who have directly typed in your URL. It can be from bookmarked URLs, and even from social media. Sometimes direct traffic is from users within your company who have the website bookmarked.
- Referral traffic. Whenever a user finds your website from another, it’s considered referral traffic. So, if someone visits Clopay Garage Doors, for example, and “clicks” on the website of a garage door dealer that carries Clopay garage doors near them, that garage door company just got referral traffic.
- Display Ads. If you’re running display ads through Google Ads, for example, the clicks they generate will be measured here.
- Paid Ads. This is where you’ll find your Google Ads traffic. If you’re running ads on other search engines like Bing, you’ll find this traffic here as well.
The Page Report
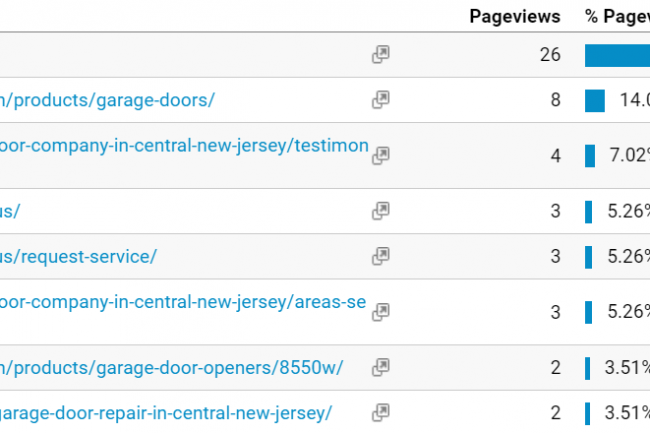 This will give you the percentage breakdown and rank your web pages from most to least visited. Usually, the highest ranking page is your home page, and you’ll see this listed as “/.” From there, you can see the top pages that users view.
This report is helpful when it comes to adding new content or optimizing pages so that you can be sure important ones are getting visits. It’s also a great tool to see what your users are really interested in on your site or about your business.
Don’t forget about goals
Google Analytics gives you the ability to set up goals for your website. If you haven’t set these up yet, we recommend you do so because it’s a great way to measure how well your website is helping your business. Essentially, goals show you whether your website is getting conversions, and you can set them up for everything from page views to contact form submissions to phone calls.
 Within the goals function, you can track goal completions within a chosen timeframe, and you can give your goals a monetary value, too. This works well if you know how much a phone call or a contact form submission can generate. Another great tool is the goal conversion rate which takes the number of goals completed within your chosen timeframe and divides them by the number of sessions.
How to set up Google Analytics
If you haven’t added Google Analytics to your website, it’s very easy to do so, especially if you have a WordPress site, or one designed with another simple content management system. If you don’t have access to the “backend” of your website or if working with a little bit of code intimidates you, ask your web developer to help.
First, visit Google Analytics and create a property for each website you want to track. Once you do that, you’ll receive a Google Analytics ID. Then, you’ll need to copy and paste the global site tag generated by Google on every web page you want to measure. We recommend placing it on every page on the tag after the header (or <head> tag).
Once you’ve set everything up, you can monitor your website’s performance and look at everything from what we’ve discussed above to all sorts of other important elements like where your users are located and what kind of device they used to visit your website.
Fair warning: Looking at your website through the lens of Google Analytics can be pretty fascinating, so give yourself plenty of time to peruse and play around in the platform to get familiar with it. The more you know, the better you can set your website up for success.